Today, North Carolina will hold its Democratic and Republican primary elections. Unlike other states voting today—like Florida and Ohio—North Carolina is not a “winner-take-all” state, and will award its delegates proportionately among candidates. Polls show Donald Trump and Hillary Clinton with strong leads in the Tar Heel state. Using demographics to project the election, we also find that Trump and Clinton will be the top vote-getters in the North Carolina primary.

In this post, we estimate both Democratic and Republican primary results by county. We use vote totals from two neighboring states—South Carolina and Virginia—to predict how each of North Carolina’s 100 counties will vote. Given changes since those states voted—namely decreases in support for Rubio and increases for Kasich—we also present two alternative scenarios: one that combines support for both candidates, and another that splits their total support evenly between them.
What predicts support for each candidate?
The first step in estimating each candidate’s electoral support was identifying the types of counties in which he/she fares well. To do so, we calculated which demographic, social, and economic characteristics are correlated with each candidate’s support in South Carolina and Virginia.

Top five correlations for each candidate. Common factors are highlighted: education in oranges, insurance coverage in yellows, economic characteristics in blues, and place of birth in gray.
Donald Trump gets more votes in counties with large proportions of residents on public assistance—namely disability, Social Security, and public medical insurance (like Medicare and Medicaid). He, along with Ted Cruz, also does well among voters who did not attend college. Both Kasich and Rubio do well in affluent, white-collar counties.
The Democratic contest is more polarized on race: Hillary Clinton fares better in counties with large African-American populations, while Bernie Sanders gets more votes in counties with more white residents. While Hillary does better in counties with greater poverty and poorer residents, Sanders fares better in counties with more white-collar workers with more education.
Estimating support by county
We then modeled each candidate’s support by county—again using results from South Carolina and Virginia. Since those two states voted, however, Marco Rubio’s support has ebbed while John Kasich has seen his vote totals increase. Republicans have also talked about consolidating support behind an “establishment” candidate.
To account for both of these, we modified the model in two ways. In one, we combined Kasich’s and Rubio’s support into a single candidate (named “Rubich”). This scenario would simulate if either Rubio or Kasich dropped out, and all of his supporters voted for the other candidate. In another, we combined their vote, and then split it evenly between both candidates. This scenario considers the increasing support for Kasich, which the decreasing vote totals for Rubio. For these alternative scenarios, we didn’t change either Trump’s or Cruz’s support.
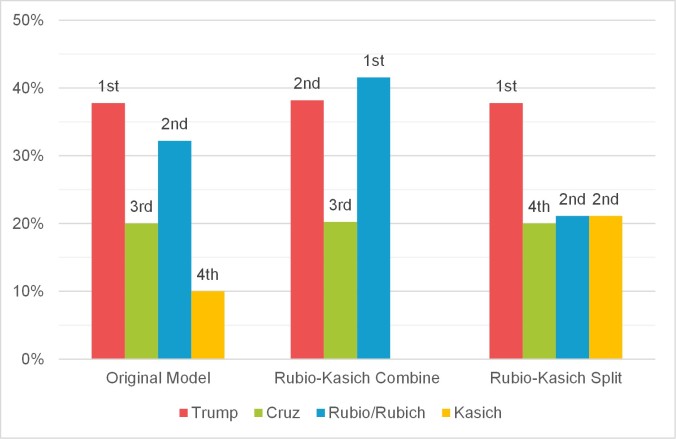
The actual model results (without modifying Rubio’s or Kasich’s support) show an overwhelming victory for Donald Trump: he wins 91 (out of 100) counties with only 38% of the vote. Marco Rubio comes in second, with 32% of the Republican electorate, and is the top vote-getter in eight counties—most of which are near the state’s largest cities of Charlotte, Raleigh-Durham, Greensboro, and Winston-Salem. Ted Cruz wins one county and receives 20% of the statewide vote. Kasich’s support is minimal (10%) and he fails to be the top vote-getter in any county.
These results shift, though, when Rubio’s and Kasich’s support is combined. The hypothetical Rubich candidate now wins 19 counties (up from Rubio’s eight), and lowers Trump’s county total to 80. Combining their support into a single candidate makes them the top vote-getter in the state, with 42% of the electorate. Trump would place second in this scenario (still at 38%), followed by Cruz (at 20%).
Combining and then splitting Kasich’s and Rubio’s votes, however, dilutes support for the “establishment” candidate. In this scenario, Rubio (or Kasich) would only win four counties, and each would receive 21% of the total vote. Trump would win 95 counties in this scenario, and Cruz still the top vote-getter in Robeson County.
The Democratic results show a resounding victory for Hillary Clinton: she wins 97 of the state’s 100 counties and receives 63% of the total vote. Bernie Sanders is the top vote-getter in three far-flung counties—Dare, Watauga, and Buncombe, which include the city of Asheville—and receives 36% of the vote.
Conclusions: Strong Victories for Trump, Clinton
The projected results here largely conform to polls of North Carolina voters: Trump and Clinton will score large victories in the Tar Heel state. Because North Carolina is not a ‘winner-take-all’ state, however, second- and third- place candidates can also expect to win some delegates.
Modifying the model, though, showcases the prisoner’s dilemma facing Kasich and Rubio. The original model results in a Trump victory, with Rubio only winning eight counties. Combining the Kasich-Rubio vote, though, would allow the hypothetical Rubich candidate to be the state’s top vote-getter. Combining and then splitting their support—which might be the most accurate representation, given electoral trends over the past few weeks—would result in significant Trump victory.
Coming soon: We return to our series on income mixing across neighborhoods with a look at Charlotte.

Pingback: North Carolina Primary Elections: Comparing our Projections to Results | Urban 2 Point 0