Presentation to North Carolina Housing Conference

On October 26th, I presented to the North Carolina Housing Conference.  The presentation—titled ‘Spread Far, Stretched Thin’—mapped affordable housing needs in North Carolina.  The three main points of the presentation are:

  • Living in substandard or unaffordable housing has effects that can last a lifetime.
  • Lack of safe, decent, and affordable housing is a statewide issue in North Carolina.
  • Lack of affordable housing is getting worse for many in the state.

It drew, in part, on CURS’s recent Extreme Housing Conditions in North Carolina report.

The presentation can be found here.  We will profile the research presented at the conference in upcoming blog posts – stay tuned!

burden-renters

The upper maps display the percent of renters in North Carolina paying over 35% of their income as rent — a condition known as ‘rent burdened.’ The lower map displays hot spots of rent-burdened households. Additional maps can be found in the presentation link above.

175FC765-394E-48E8-9D8A-7B351C5CCC31-01

Me presenting at the 2017 North Carolina Housing Conference. I did not request nor drink all those water bottles.

Collaborating to Find Solutions for Vietnam’s Social Housing Shortage

Background

Vietnam is undergoing a transition from a rural, agricultural society to an urban, industrialized one. We’ve already seen transitions like this in East Asia – first in Japan, then in South Korea and Taiwan, and most recently in China.

Group on street.JPG

Dr. Michael Webb, and Vietnamese scholars touring privately-owned apartments that are leased to factory workers. The owner (in the red vest) was displaced from her farm when the industrial zone was built. She and her husband built the apartments to rent to the factory workers.

Vietnam’s economic and social transformation since the U.S. normalized relations between 1995 and 2000 has been significant. Since 2000, the county’s GDP has increased 481%, from $34 billion to $195 billion. Per capita income has increased from $400 per year to $1,990, nearly quintupling, in the same period. The percent of Vietnam’s residents living in cities – a fairly good indicator of industrialization – has risen from 24% in 2000 to 34% today.* This urbanization figure is still below other counties in East Asia, though – China’s population is 56% urban and South Korea’s is 61% urban.

As Vietnam industrializes and urbanizes, the country is struggling to provide housing to people migrating to its industrial zones from rural parts of the country. While Vietnam has succeeded in attracting foreign-owned factories, its government has not provided sufficient housing for the workers. In fact, a recent study found that, of the 2.8 million workers in Vietnam’s industrial zones, 1.7 million are in need of housing.

The conference

conference.jpg

Dr. Mai Nguyen

webb.JPG

Dr. Michael Webb

To begin addressing Vietnam’s social housing issues, the National University of Civil Engineering (NUCE) hosted a conference on social housing, titled “The Overall Picture of Social Housing – Challenges and Opportunities,” in December, 2016. Presenters included academics from NUCE, representatives from the Vietnam National Real Estate Association, and the Vietnam National Construction Association. In addition, Dr. Mai Nguyen – who is a professor in UNC’s Department of City and Regional Planning and a CURS Faculty Fellow – and I presented on our research in public housing in the U.S.

What emerged from the conference is the need for collaboration between researchers in the U.S. and Vietnam to solve housing issues for low-income families. As mentioned earlier, affordable housing is in short supply near the industrial zones.

Social housing in Vietnam today

Toward the end of the trip, Mai and I had the opportunity to do a site visit to the Thanh Long industrial zone outside Hanoi. Working with researchers from NUCE, we wanted to see how workers in the industrial zone actually lived – both in government-owned buildings and in private apartments. Broadly, housing for workers in the industrial zones includes:

  • Social housing built by the government, where rents are subsidized so that they’re affordable to workers in the factories. There are acute shortages of this type of housing.
  • Social housing built by the government but owned or lease by companies. Some companies in the industrialized zones have purchased or lease government-built housing that they rent out to their workers. The companies may provide services to the workers as well, like daycare.
  • Privately-owned housing. If workers can’t find social housing, they don’t like the social housing, or their company doesn’t provide housing, they must rent from private landlords in villages outside the industrialized zone. Some of them have very long commutes to their jobs. This is, by far, the most common type of housing for industrial zone workers.
apartment block.JPG

Social housing outside Hanoi

There are two types of social housing at Thanh Long: dorm-style units (with some floors reserved for men and others reserved for women) and high-rises with traditional apartments. The dorms are more targeted to single men and women, while the apartments are mainly for families (and are much more expensive).

In addition, Canon – the Japanese camera-maker that is also a major employer in the industrial zone – has rented out some of the social housing. The housing is very inexpensive, and Canon provides a daycare facility, kindergarten, and evening Japanese and English language classes.

English.JPG

Many companies that lease social housing to their workers also offer services like daycare and English or Japanese language courses.

There are two villages near the industrial zone, and many of the workers live in private apartments there. We spoke with a landlord who was displaced from her farm when the Vietnamese government cleared land for the industrial zone. She and her husband purchased a storefront in the village and currently operate it as a small shop.

interior.jpg

Dorm-style social housing offers residents community kitchens, pictured above.

bunks.jpg

Dorm-style social housing.

Behind the store, they built around 12 apartments, each about 15 feet square. The tenants share a common bathroom and kitchen; individual apartments don’t have a faucet and each has a single electrical outlet. Other apartments in the village are similar:  between 15-20 feet square, a few electrical outlets, and possibly running water. Most households are either a single person or a couple; if they had kids, most had sent them to their home village to live with extended family.

Future efforts

There are many similarities between social housing in Vietnam and public housing in the U.S.  Both counties face acute shortages: only 40% of workers in Vietnam’s industrial zones have social housing, while in the U.S., public housing only serves about 25% of those in need. In response, low-income residents in both countries must rely on the private market for housing.

In 2017 and beyond, researchers at NUCE and UNC will collaborate to better understand Vietnam’s social housing issues and develop policy solutions. Our partners in Vietnam are currently testing a survey of workers in the industrial zones outside Hanoi to understand their current housing situation, and how it can be improved. We’ll use the results of the survey to craft policy recommendations for the Vietnamese government to identify ways to finance and build social housing.

* In case you’re interested in comparisons: Vietnam’s total GDP is roughly the same as Greece’s or Kentucky’s; its per capita income ranks between Uzbekistan and Nicaragua, and its urbanization rate is roughly the same as India’s.

Understanding North Carolina’s Urban-Rural Divide

NYTimes.JPG

A recent article in the New York Times asks whether “North Carolina is the future of U.S. politics.” The article describes the state’s contentious political battles – most notably on House Bill 2, otherwise known as the ‘bathroom bill.’

One explanation given for the state’s political divide is a topic we’ve recently covered here at Urban2Point0: the concept of ‘two North Carolinas’ (we’ve called it ‘a Tale of Two States’). The author argues that:

The State’s metropolitan areas continue to prosper, with an influx of white-collar workers drawn to their thriving finance and technology sectors. But in North Carolina’s rural communities, the tobacco, textile, and manufacturing industries have collapsed, with little taking their place.

These economic disparities – and their relationship with areas either economically growing (where residents are more liberal) or shrinking (conservative) – exacerbate North Carolina’s partisan divides. The article quotes a state senator from rural North Carolina as upset about announcements of firms moving to Raleigh or Charlotte, arguing that “it’s like fish in a barrel.” He worries that efforts to attract firms and residents to cities will result in North Carolina losing what he feels are its traditional roots.

In this post, we’ll provide additional context to the New York Times story using data from the A Tale of Two States series. As in our previous posts, we’ll examine changes in private-sector employment between 1990 and 2015. (If you’re interested in probing these issues deeper, we recommend reading our previous posts on the subject.)

The growing service sector economy

The U.S. has seen its economy shift from manufacturing to the service sector since the 1970s. North Carolina is no exception to this trend. Between 1990 and 2015, the state’s fastest-growing industries were professional services, education and health care, and hospitality. In fact, the service sector comprises the top six fastest-growing industries in the state, and seven of the top eight.

industry.JPG

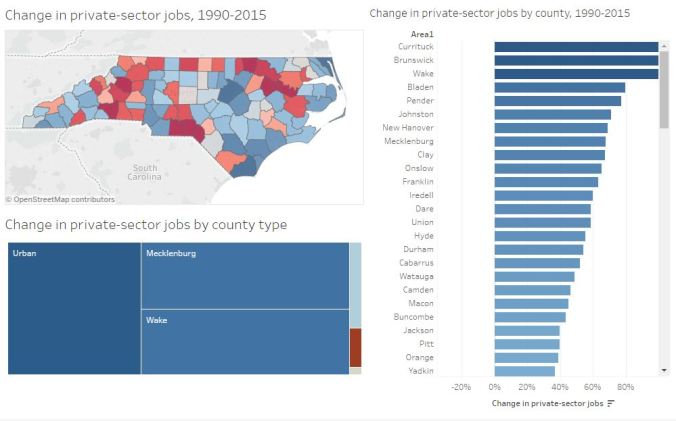
One finding from A Tale of Two States is that growth of service-sector jobs across North Carolina has been strikingly uneven. Urban counties have gained hundreds of thousands of jobs while non-metro counties – including small towns and rural areas – have only gained a small number or even lost jobs. Between 1990 and 2015, metro counties added nearly 739,000 jobs, while rural and small town counties lost over 6,000 jobs.

Change-in-private-sector-jobs.JPG

click above image to interact

Concentrating growth in urban areas

This disparity between metro and non-metro counties is evident when we examine job growth in the service sector, which has accounted for nearly all of the state’s new jobs. Counties in metro areas are classified as either urban or suburban and are in shades of blue in the figure below. Non-metro counties are either classified as rural or small towns and are in shades of orange. We’ve separated Mecklenburg and Wake Counties because they account for so much job growth.

urban-rural-divide.JPG

click above image to interact

For nearly all service industries, metro counties have accounted for at least 90% of private-sector job growth. In fact, for each industry, at least half of all job growth has occurred in just two counties: Mecklenburg (Charlotte) and Wake (Raleigh). Given that these two counties only account for 10% of the North Carolina’s population, one can see how service jobs have disproportionately clustered in these areas.

urban-rural-divide2.JPG

click above image to interact

Even more worrisome for non-metro counties: for the highest-paying industries in the service sector, job growth is even more concentrated in metro areas. For example:

  • Information: 100% of all job growth in metro areas (Mecklenburg and Wake Counties to be exact); average annual pay for these positions in North Carolina is $76,624.
  • Finance: 92% of all job growth in metro areas; average annual pay is $78,029 statewide.
  • Professional services: 91% of all job growth in metro areas; average annual pay is $58,748 statewide.

In comparison, the two service-sector industries where non-metro counties have done slightly better – education and health care in addition to hospitality – have annual average salaries of $44,753 and $18,236, respectively.

Are there policy responses?

North Carolina’s experience of urban growth and rural decline is not unique: across the U.S. and industrialized world, service-sector jobs are concentrating in cities and metro areas.* Scholars have proposed several reasons for why this is occurring. These include:

  • College graduates generally prefer to live in cities, so locating jobs in urban areas makes it easier to attract employees.
  • Service industries don’t occupy as much land as manufacturing, so firms are less sensitive to the price of land (which is much higher in cities than rural areas).
  • Service industries – particularly finance and technology – benefit from being in proximity to one another, particularly from their employees interacting with those at other companies. This is easier in cities than in spread-out rural areas.

The New York Times article quotes State Senator Ralph Hise as arguing that “it’s really going to take workforce development and recruiting and economic incentives … to tag those industries that can come into this state and serve in one of the rural areas.” Some Southern states – notably South Carolina (Boeing and BMW) and Alabama (Airbus and Mercedes-Benz) have attracted manufacturing with incentives.

It takes substantial funds, though, to attract these factories, and competition among states is fierce. Further, new manufacturing facilities often piggyback off previous ones. North Carolina’s inability to attract manufacturing in the past may hinder its ability to attract factories now.

North Carolina may consider incentivizing other industries for non-metro counties. The state has already enjoyed some success attracting logistics firms, which can then help attract manufacturing and warehousing businesses. Any efforts to attract jobs to rural areas, however, shouldn’t be at the expense of efforts to attract service-sector industries to urban areas. Ultimately, an approach that leverages North Carolina’s strengths in finance and technology, and its emerging logistics sector, may be the best path for economic vitality in all parts of the state.


* A very quick calculation shows that approximately 93% of all private-sector job growth between 1990-2015 occurred in metro areas.

A Tale of Two States IV: Hospitality Jobs

robert-weber-nowadays-most-of-our-income-is-from-tourism-new-yorker-cartoon.jpg

For our final industry profile for the series, A Tale of Two States: Job Growth and Change in North Carolina, 1990-2015, we’ll turn our attention to hospitality and leisure-sector jobs. Jobs in this sector include those in the arts, entertainment and recreation fields, in addition to accommodations (like hotels) and food services (restaurants). These service-sector positions are generally lower skilled and have lower pay than the average job. For example, the average annual pay for a hospitality/leisure job in North Carolina is $18,236 – less than half of the statewide average of $46,531.

Hospitality jobs have grown sharply in the state. Between 1990 and 2015, jobs in this sector nearly doubled – an increase of over 225,00 jobs – and now comprise 14 percent of North Carolina’s jobs (up from 9 percent in 1990). Among the ten major industry sectors tracked by the Bureau of Labor Statistics (BLS), leisure/hospitality ranked third in terms of both growth in actual jobs and percentage-wise.

Change in private-sector employment by industry, 1990-2015

change.png

North Carolina’s Hospitality Sector

Unsurprisingly, the counties with the largest share of jobs in hospitality are located in the state’s two tourist draws: the mountains and the coast. The leading counties for hospitality jobs in 2015 include Dare (which includes most of the Outer Banks), Swain (located within Great Smoky Mountains National Park), and Perquimans (along Albemarle Sound). All of these counties have over 30 percent of their jobs within the hospitality industry.

Away from the state’s tourism hot spots, most counties have between eight and 13 percent of their workforce in the hospitality industry. Exceptions to this include Moore County – home to the Pinehurst Resort and Country Club – and Orange County, likely due to businesses catering to visitors to the UNC-Chapel Hill campus.

Hospitality Job Growth

Nearly all of North Carolina’s counties saw their number of hospitality jobs increase between 1990 and 2015. Somewhat unexpectedly, the greatest increase in hospitality jobs occurred in Cabarrus County, just northeast of Charlotte (and nowhere near the mountains or the coast). The county is home, however, to the Charlotte Motor Speedway and related attractions, in addition to a large shopping mall and waterpark resort (and, of course, terrible traffic).

Other strong gainers in hospitality jobs are in areas more traditionally associated with the hospitality industry. These include Graham County in the state’s southwestern corner (+321 percent), Brunswick County just outside of Wilmington (+261 percent) and Pamlico County along the coast (+258 percent).

In terms of raw growth numbers, Mecklenburg and Wake Counties have added the most hospitality jobs (80,396 across the two counties). However, these figures represent a relatively small proportion of the total jobs added across the state (about 35 percent). This differs from other industries – including finance and professional services – where Mecklenburg and Wake accounted for over half of the state’s job growth.

The State’s Increasing Reliance on Hospitality Jobs

As we discussed at the beginning of this post, leisure and hospitality is one of the state’s fastest-growing industries. As a result, an increasing number of jobs in the state are within this sector, as shown on the map below. Overall, the percent of North Carolina’s jobs in the hospitality sector increased by five percentage points between 1990 and 2015.

hospitality.JPG

click above image to interact

Among the state’s 100 counties, 96 of them saw the hospitality sector either grow or remain roughly the same between 1990 and 2015. Many of the counties seeing significant expansion of the hospitality sector include areas of southwestern and southeastern North Carolina popular with tourists. Surprisingly, in Dare County, hospitality jobs decreased as a percentage of all jobs (from 34 percent of all jobs to 32 percent), though the sector still comprises nearly one-third of all jobs in the county. This decrease might actually be a positive for the county, as it indicates that its economy is diversifying beyond the tourism industry.

Looking Ahead

This post is our last look at individual industries in North Carolina (it just so happens that hospitality has the highest BLS code). Our next post – the last in this series – will classify the state’s 100 counties based on their job growth over the past 25 years. Using a statistical technique called cluster analysis, we’ll look at the similarities and differences across North Carolina’s counties, and see if any geographic patterns emerge. Cluster analysis also has the benefit of allowing us to consider job growth (and losses) across the 10 industrial codes used by the Bureau of Labor Statistics.

A Tale of Two States III: White-Collar Jobs

156289-BMMANKOFF

Welcome back to Urban2Point0! After an extended holiday break in a time zone far, far away (post forthcoming), we’re ready to wrap-up our analysis of North Carolina’s job growth.

Our last post showed how, in a period when North Carolina added nearly three-quarters of a million jobs, the state also experienced significant job losses in the manufacturing sector. Small towns and rural counties were hit especially hard by these job losses – in fact, small towns lost nearly half of their manufacturing jobs between 1990 and 2015.

In this post, we’ll shift our attention to white-collar jobs, specifically finance and professional services – which includes management, research, and engineering.* These industries have driven job growth in both North Carolina and the entire U.S. over the past decades. White-collar jobs tend to concentrate in large cities, and North Carolina is no different – with Charlotte serving as a major financial center and Raleigh as a hub of research and technology.

The two white-collar industries that this post examines are finance and what the Bureau of Labor Statistics calls “professional and business services” – more on that below. Not surprisingly, both finance and professional services jobs have increased in North Carolina since 1990. The state has added over 78,000 finance jobs since 1990, more than doubling in that time period. For professional services, North Carolina gained over 350,000 jobs – a greater than 150 percent increase.

There are two ways of looking at the county-level data, and each way tells a different story. When we look at percentage growth over the past 25 years, many counties have experienced very sharp increases in both finance and professional jobs. For instance, Madison County in extreme western North Carolina increased its professional services jobs by 497 percent, while Currituck County (in the state’s northeastern corner) increased its financial services jobs by 680 percent.

When our focus shifts to the number of jobs added, though, the conclusions shift dramatically. Mecklenburg and Wake Counties have added by far the most white-collar jobs, with only small increases in small towns and rural counties. In fact, that 497 percent in Madison County only represents an increase of 497 positions. The 680 percent increase in Currituck County’s finance jobs translates to only 544 actual jobs added.

finance

click above image to interact

Continue reading

A Tale of Two States, Part II: Manufacturing

Since the 1970s, the U.S. economy has undergone a significant shift away from manufacturing and toward service industries. North Carolina has not escaped this larger trend, as production of its two signature products – furniture and textiles – has relocated to foreign counties, most notably China and Mexico.

In this post, we’ll examine one negative aspect of economic restructuring on North Carolina: loss of manufacturing jobs. The offshoring of the state’s furniture and textiles industries has negatively impacted many of the state’s counties, especially those between Charlotte and Greensboro.

To be blunt, the change in North Carolina’s manufacturing sector has been significant, although it resembles shifts occurring elsewhere in the country. The state has lost 44% of its private-sector* manufacturing jobs since 1990, with some counties losing over 75%. Only four have gained manufacturing jobs within that time frame, and only one of these – Bladen, just outside of Fayetteville – has gained an appreciable number.

Continue reading

A Tale of Two States, Part I: Job Growth in North Carolina since 1990

Many know that North Carolina is one of the fastest-growing states. It has added nearly 750,000 private-sector jobs since 1990, and its population recently eclipsed the 10 million mark. This job growth hasn’t touched all parts of the state, though: half of it has occurred in only two counties, and over one-third of the state’s counties have actually lost jobs over the past 25 years.

In the next series of posts, U2P0 will examine how the geography of jobs across the state has shifted since 1990, both overall and for specific industries.

Between 1990 and 2015, North Carolina’s population increased by nearly 3.5 million – a 52% gain – and the state added 766,992 private-sector jobs, which represents an increase of 29% over 1990 figures. Due to the state’s growing economy, Raleigh was recently ranked as the number one city for jobs by CNN.

Despite this strong job growth, 38 of the state’s 100 counties have fewer private-sector jobs in 2015 than they did in 1990. Twenty-six of those counties – over two-thirds of them – are either small towns or rural in character, and many are in the western and northeastern parts of the state. Much of these job losses have occurred as agricultural and textile industries have either shrunk or moved offshore.

jobgrowth

Click on the above image to interact.

Continue reading

A Tale of Two States: Job Growth and Change in North Carolina, 1990-2015

Over the last twenty-five years, North Carolina has been one of the fastest-growing states in the country. The state’s economy has diversified beyond agriculture and manufacturing to become dominant in both finance and technology. The state has also attracted retirees drawn to its high-class medical facilities, especially in the Research Triangle area around Raleigh and Durham.

This economic transformation has not benefited the entire state, however. Small towns and rural areas – many reliant on tobacco farming and textile manufacturing – have lost both population and jobs as their economic prospects have dimmed. Some of these counties, though, have reinvented themselves as tourism hubs – particularly in the western part of the state.

In the next series of posts, U2P0 will examine the changing geography of jobs in North Carolina from 1990 to 2015. Using data from the Bureau of Labor Statistics, we’ll report private-sector job changes both overall and within certain industries. The first post will examine total job changes from 1990 through 2015, and our attention will then turn to manufacturing, technology, finance, and tourism.

We’ve termed the series “A Tale of Two States” to reflect the highly-divergent economic trajectories of the state’s counties. Over half of the state’s private-sector job growth has occurred in two counties: Mecklenburg (Charlotte) and Wake (Raleigh). Outside of those places, counties have either gained a more modest number of employment opportunities or struggled with job loss.

Transportation Affordability in North Carolina’s Triad Region

Like the Triangle, the Triad is a sprawling region with several urban centers. In the same 2014 rankings that we’ve reported for the Triangle and Charlotte, Winston-Salem and Greensboro-High Point were ranked the 13th and 14th most-sprawling metros in the nation. Each scored particularly poorly on street connectivity – meaning that even short drives may take longer due to fewer routes between two places.

Sprawl is a bit of a double-edged sword for transportation affordability. Spreading jobs throughout the metro area could reduce transportation costs by making commutes shorter. However, the Triad’s poor public transit and lack of street connectivity forces many families to spend a disproportionate amount of income on transportation.

Continue reading

Transportation Affordability in Metro Charlotte

Like other North Carolina metros – and many cities throughout the Sunbelt – Charlotte is very sprawling.  A recent report ranked the city as the 25th -most sprawling in the country.  However, among metros with a population of over one million, Charlotte ranked 5th in terms of sprawl.*

charlotte_screencap

Households devote less of their income to transportation in the denser parts of Charlotte.  Click the map to interact with it.

Continue reading